In this article, you will learn how to use Built-In Monitoring on our Virtuozzo PaaS service. There are three aspects of gathering information in order to troubleshoot a problem or be alerted in case there is an issue with your environment.
View Log Files
In case you face issues with your environment the first step is to check the log files. For example, any development or testing task requires access to this crucial information.
Step 1: Log in to the Virtuozzo dashboard with your credentials.
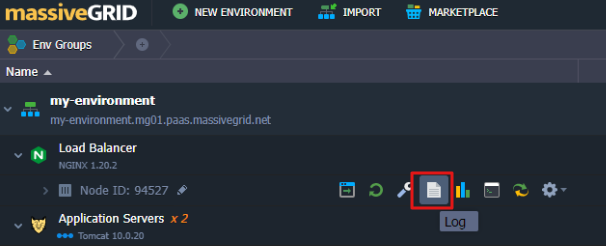
Step 2: Click the Log icon for the required node.
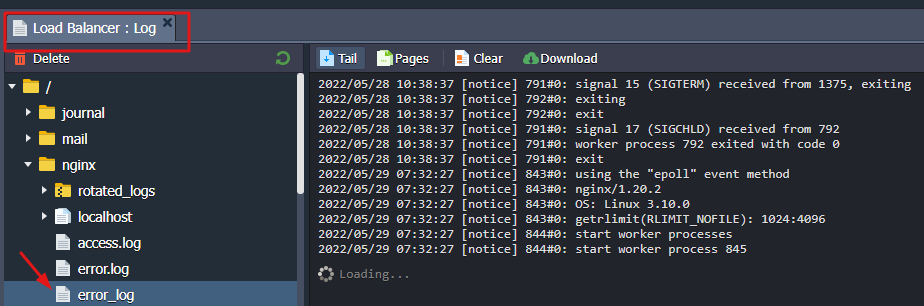
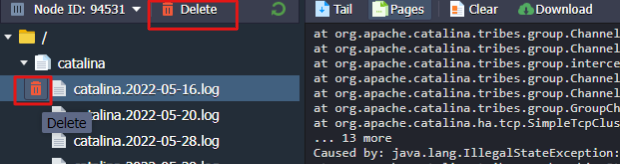
Next, a new tab will appear at the bottom of your dashboard. You can navigate through every log of your node. For example, if you have an Nginx node you and you encountered issues you can navigate to /nginx/error_log.
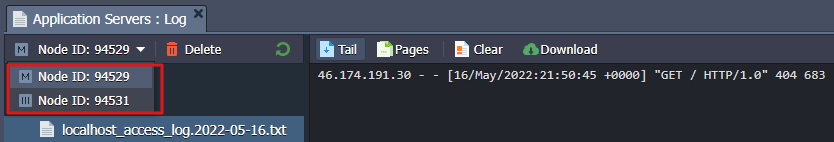
If your environment contains several nodes of the same type, you can choose the one you want to see the logs for in the drop-down list.
Note: In order to make the monitoring of the logs even more convenient, the Auto-refresh feature is used, which is enabled by default. It makes the currently opened log file to be refreshed every 3 seconds and thus removes any delay or necessity to refresh them manually in order to get the up-to-date information, allowing to track real-time processes like installation or updating with ease.
If you wish to delete a log file, you can easily perform this action by hovering over the related server log and clicking the appeared bin button or selecting it and pressing Delete at the top tools panel.
Depending on the nodes that you have created your environment, you can view the below logs:
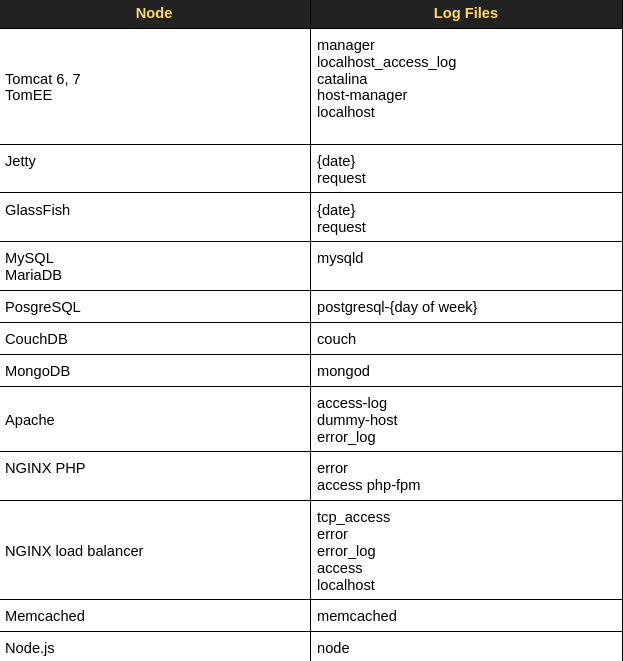
Note: If you use the remote GIT/SVN repository for deploying your application, a new vcs_update pull log file is added to your Maven node (for Java) or Apache/NGINX application server (for PHP), which contains the information on your project’s building and deploying.
View Statistics
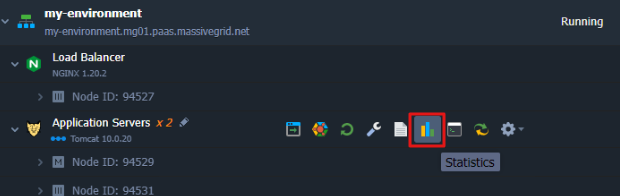
Virtuozzo’s dashboard also provides the in-built statistics module that cover’s all the billable resource consumption, so it can help you to adjust the topology according to your needs. You can view the usage statistics for all the nodes in your environment by clicking the Statistics button.
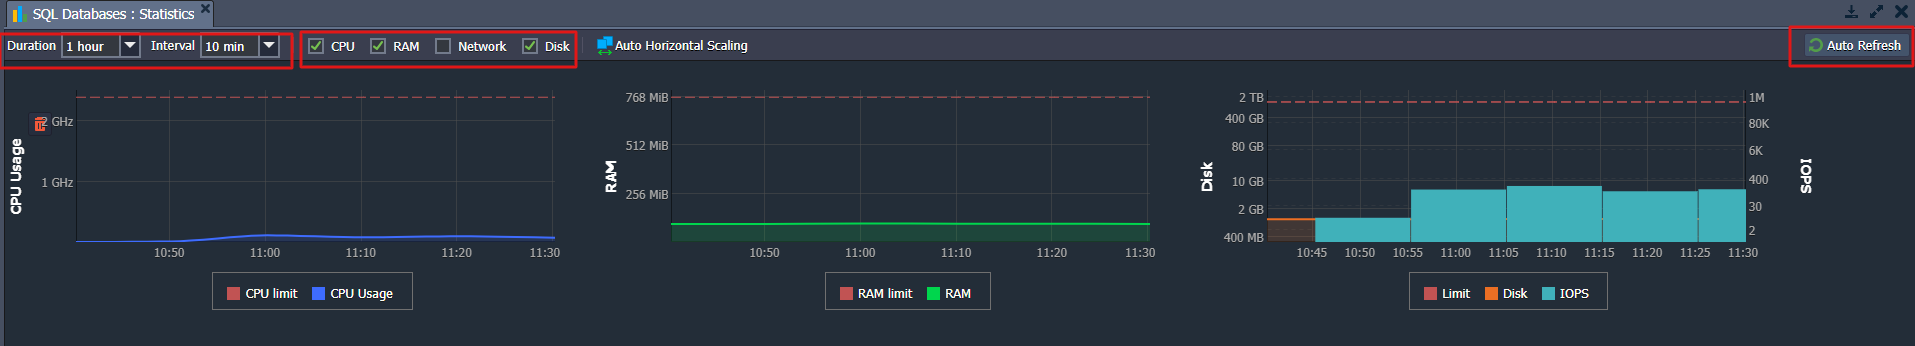
Next, a new tab will appear at the bottom of your dashboard. In the opened tab you’ll find the statistics on all the types of consumed resources and their limits:
- RAM - memory consumption (in MiB)
- CPU - processor load (in MHz)
- Network - internal and external traffic (in MB)
- Disk - stored data amount (in MB) and I/O operations amount (in IOPS)
You can further analyze the presented statistics by varying the Interval and Duration settings and enabling/disabling the particular sections at the top tools panel:
Note: Virtuozzo PaaS collects statistics every minute and stores it for an hour to implement an accurate Pay-per-Use charging approach. Afterward, the data is automatically aggregated into the one-hour blocks, using one of the two methods based on the particular resource type:
- a sum of all values for CPU, Network, Disk IOPS, and Disk IO
- the maximum value for RAM and Disk
I/O Usage Monitoring
The Input/Output Operations per Second amount monitoring is the very common and popular storage measurement method, which helps to analyze the container’s efficiency based on its ability to handle a particular number of read and write operations simultaneously without the performance degradation.
You can view the IOPS data within the Disk statistics section by means of the second axis to the right of the graph.
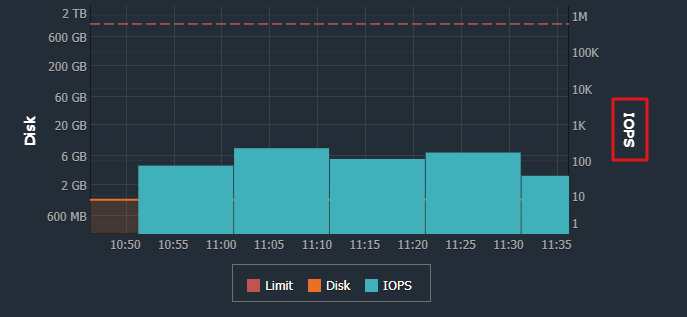
The more operations are handled - the higher the system load is. In order to avoid the hardware efficiency degradation, the allowed IOPS amount is limited - the appropriate threshold and is marked with the red dotted line at the top of the graph.
Reaching this point implies that the performance of your container can be negatively affected, so it is needed to enlarge the number of servers used or to optimize the application itself.
Upon hovering over the particular point at the Disk/IOPS graph, you’ll see the popup tooltip with the following details:
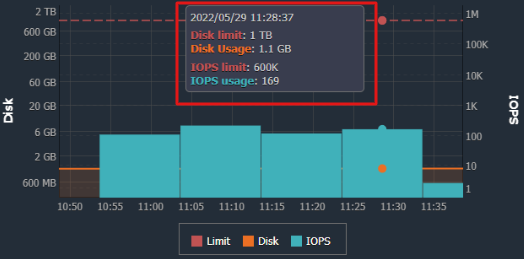
- date and time of the gathered stats
- Disk limit - the maximum amount of data that is allowed to be stored in a container
- Disk Usage - the amount of space container is actually using
- IOPS limit - the maximum number of I/O operations, allowed to be performed by the container during the stated Interval
- IOPS usage - the number of I/O operations handled during the stated Interval
Load Alerts
In order to monitor your application’s loaf and the amount of the resources it requires, you can configure a set of automatic notifications triggers. They are executed if the usage of a particular resource type is above/below the stated value (%) during the appropriate time period. As a result, you’ll get an email notification about your application’s load change.
In order to configure an alert, follow the next instruction:
1) Click the Settings button for the desired environment:
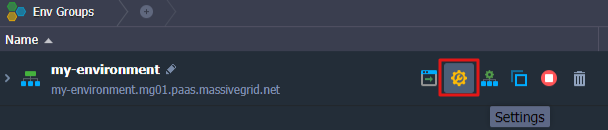
Next, a new tab will open at the bottom of your dashboard.
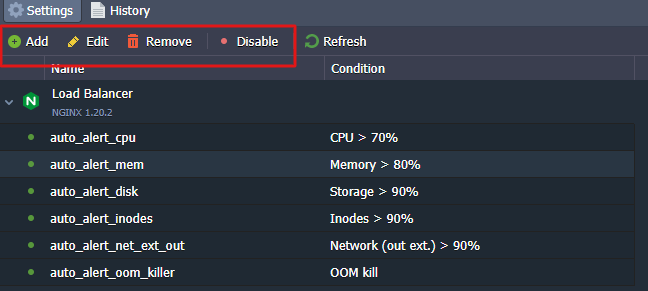
2) Navigate to the Load Alerts section:
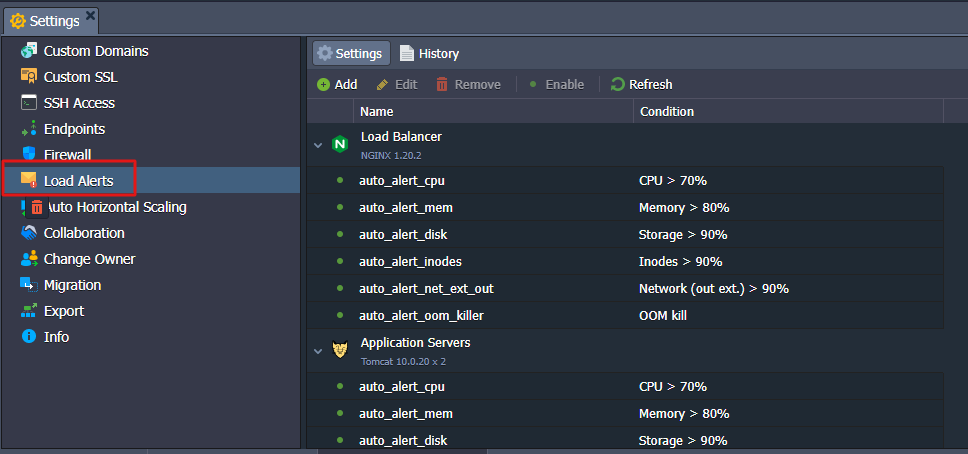
In the above section, you can find several default triggers, which are automatically added during the creation of your environment. These triggers are to notify you when the RAM, CPU, disk, inodes, or network traffic usage at any node is coming close to current resource limits.
You can use the tool panel in order to Add a new alert or Edit, Remove, Enable/Disable existing ones.
For example, if you wish to add a new alert, you can follow the below steps:
1) Click the Add button from the tools panel as shown above.
2) A new tab will appear where you need to define the below values:
- Name - the name of the notification trigger
- Nodes - the type of the environment’s node
- Whenever - type of resources that will be monitored by the trigger: Cloudlets (Memory, CPU), Memory, CPU, Network (out ext. + in ext.), Network (out ext.), Storage (disk space amount), Disk I/O, Disk IOPS, and Inodes
- Is - condition for trigger invocation/execution, due to which the resource consumption should be above or below (the “>” or “<” values correspondingly - use the first combo-box) of the stated percentage or Mbps for the Network monitoring
- For at least - time period before trigger execution, during which it should remain invoked
- Notification frequency - delay for the repetitive message to be sent
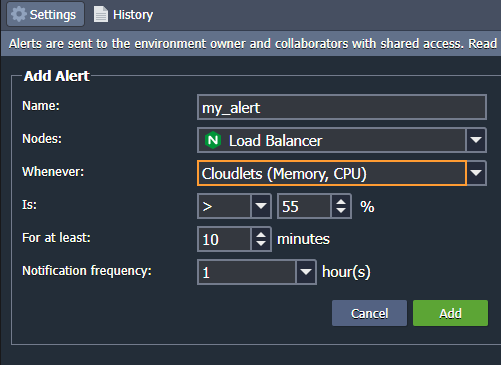
3) Once you have filled all the above values, press the Add button.
After a couple of seconds, your new alert will appear in the Load Alerts section
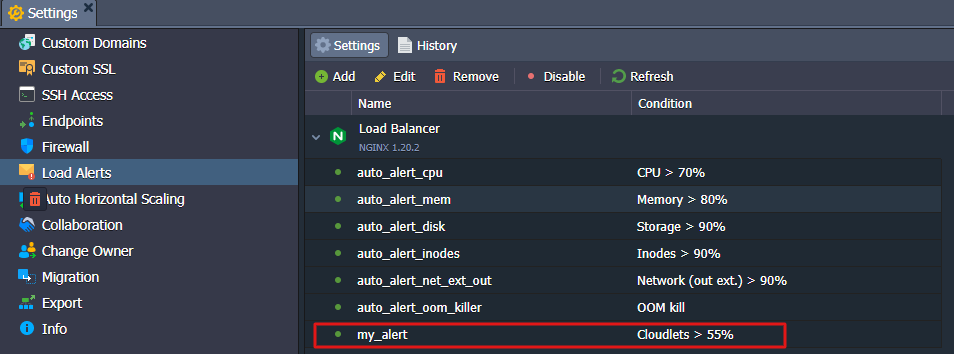
As a result, every time the resource usage comes above/below the stated percentage (depending on the condition stated) during the specified time period, the system will send you an email notification with the current level of consumption, some recommendations on this issue and direct link for the node’s scaling limit adjustment.